Alexis S. Becker
Director

Executive dashboards support executive decision making
There are many personal qualities and traits that distinguish successful business owners — but they all share one thing in common: Through whatever means possible, they can understand at any point in time how their business is performing based on growth projections, execution, profitability, and capacity.
If you’re running a business, are you able to achieve these insights with the tools at your disposal? If the answer is no, your business may be headed down a dangerous path — and you may not even know it. What should you do? Where do you start? A first step is to consider the executive dashboard.
What is an Executive Dashboard? A Deep Dive
An Executive Dashboard is a visual representation that gives executives a quick and easy way to view their company’s performance in real-time (Forbes). MAXIS® by Freed Maxick is an invaluable leadership tool that provides actionable, measurable insights to drive productivity, performance, and profitability. MAXIS accelerates sustainable growth by helping business owners better understand their data and make more confident decisions, often with the strategic use of custom executive dashboards.
Dashboards are not a “one size fits all” kind of tool. For maximum understanding of the multitude of factors needed to fully comprehend the organization’s performance, the customization of the executive dashboard is necessary. The ability to create the unique path to your company’s goals is more easily achievable. Being able to respond quickly with agile decisions to reduce loss and risk, and increase productivity and profitability is every leader’s dream. Dashboards provide the busy executive with the information necessary to help them make timely decisions. 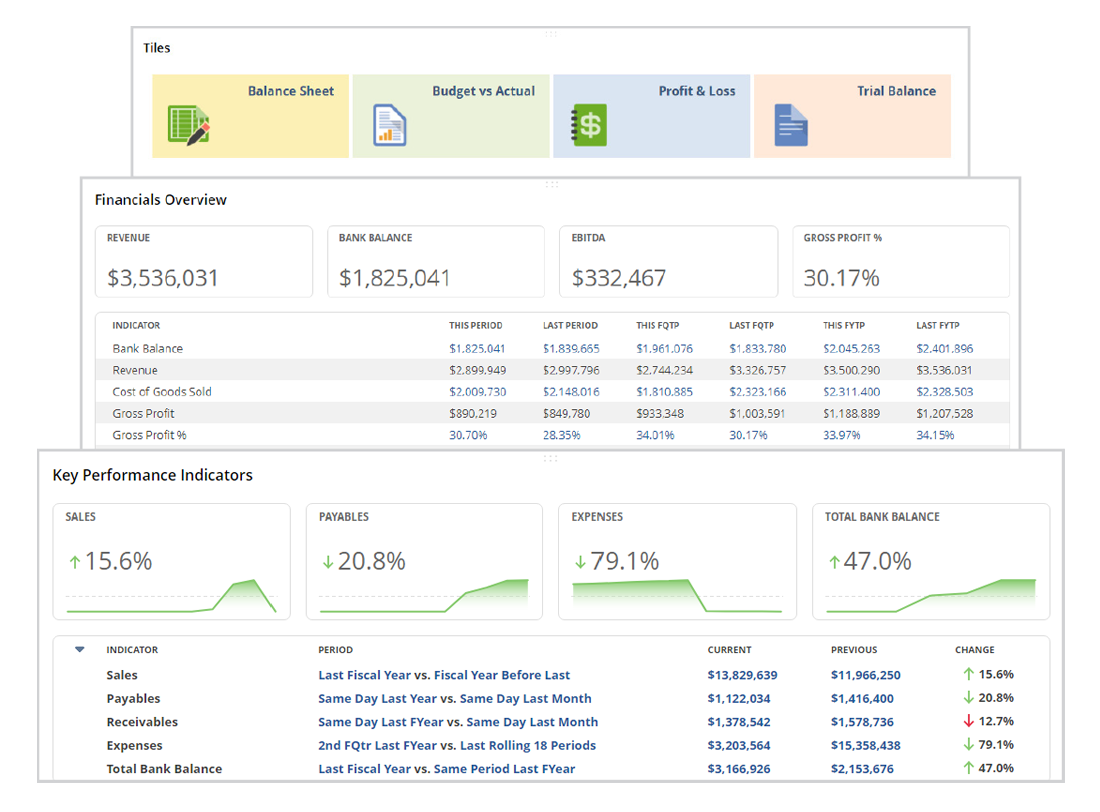
Sample Dashboard - Click to Enlarge
When appropriately customized, dashboards also facilitate cross departmental (finance, marketing, sales, etc.) metrics to be pulled into a high-level, big-picture snapshot of the company’s current standing at a point in time. That data allows executives to see Key Performance Indicators that signal the overall health of the organization and monitor its progress toward specific goals. Key Performance Indicators, or KPIs, are the benchmarks that are reviewed over time to measure performance. At any point, the executive can make a deep dive into a specific category to explore the drivers, obstacles, timing, and targets.
An optimal executive dashboard should give you the information you need to answer four primary questions:
- Are you growing?
- Are you profitable?
- Are you executing for your clients or customers?
- Are you retaining and growing your client base?
If you currently use one, does it deliver broad insight in these? If you don’t have one, you should take immediate steps to put one in place.
Executive Dashboard Metrics
In our work with small to mid-size businesses at Freed Maxick, we regularly see organizations with antiquated or inaccurate technology in place, people who aren’t trained in using it appropriately, tools that aren’t of any benefit, and resources that provide no support to leadership. MAXIS provides more certainty for leaders to be better organized, prepared, and informed to make stronger decisions.
Many executives think of a dashboard in terms of tracking financial data, like the monthly costs of supplies for budgeting and forecasting, or current cash flow for unexpected financial needs. And they’re not wrong. But dashboards can — and should — do so much more.
MAXIS has defined four crucial elements of effective executive dashboard metrics:
(1) Client/market-related data. This includes insight such as:
- Customer churn – To what extent are you retaining, and keeping clients happy? It’s six times more expensive to acquire a new client than to keep an existing client, and that acquisition is getting harder. Most clients will never tell you of their concerns; rather, they almost always vote with their feet. Nearly all businesses are well served to build and nurture existing client relationships. Your ability to do so – as evidenced by client churn data – should by itself provide a valuable assessment of your business’ current performance.
- Average purchase size – Say, for example, that an average sale for your company is $10,000. Recently, though, that figure has started to drop off. Including this metric on your dashboard is vital; first and foremost, it alerts you to the issue, and by extension, may provide insight on why that is happening. From this, you can plan remedial actions or be better informed when it comes time to forecast things like raw material purchases.
- Shift(s) in products purchased – This can help you understand if your clients’/customers’ needs are changing. Maybe someone is buying steel components from you today, but what they really need is wires to connect those things together. Or, perhaps the volume of steel purchases is declining, and complementary products – nails, screws, grease, wire – is increasing. This could mean customers have over-ordered, or even found an outside supplier that’s cheaper for consumables. If volumes change, or what they buy from you changes, this metric alerts you to it.
(2) Margin. If gross and/or net margins drop, but revenues remain constant, that could point to an increase in expenses, or a decrease in production efficiency. Again, your executive dashboard should provide the tools to help you understand how margins are changing and why. Are the reasons behind change seasonal, or due to unusual or unforeseen circumstances? Your dashboard should be equipped to allow you to click on a margin-related metric, see what’s happening in real time and understand what’s driving that issue.
People make purchasing decisions on three primary drivers: price, quality, and relationship. Price is the first thing they’ll switch on, they will start to sample next on quality, and finally, relationships. If sales of your products are decreasing, that may be a sign that someone has undercut your prices.
(3) Execution. Companies run in transactional ways with associated transactional activities. Dashboard metrics that track execution on key activities – e.g., product launches, lead generation/pipeline initiatives, product and service launches – offer both quantitative and qualitative measures of progress and success. Take lead generation, for example. An effective dashboard should quantify the number of active leads, measure that volume against established criteria, specify which deals are closing and so on. Some of these measures may need to be manually collected and are more subjective—but they still provide valuable insight into what’s working.
(4) Talent. We include this last, but it’s far from the least important. Companies of all sizes and scopes face talent challenges — and meeting these challenges is in many ways an existential necessity. Talent metrics on an executive dashboard are crucial in helping you determine whether you have the capacity to deliver against your client commitments. They help you answer important questions such as:
- Do we have enough people to meet our commitments?
- Can we deliver on time and to the right level of quality?
- Do we have the right skill sets?
- Are our people producing effectively?
- What does our hiring pipeline look like?
- What is our “win rate” on hiring?
- What is our staff churn rate (and what may be causing a higher churn rate)?
- If we have vacancies, can we fill those in a timely manner with highly qualified people? If not, what does that do to our production backlogs?
- What do our costs, like compensation and benefits, look like when compared to industry averages
Again, a properly designed executive dashboard should enable you to accurately gauge the effectiveness of the core drivers of your business at any given point in time, draw intelligent conclusions and determine the right course of action for you and your team.
If you have an existing dashboard in place, we recommend that it includes measures for each element described above. If you’re looking to develop one, it’s best to consult an experienced business professional with data analytics capabilities, like the MAXIS team at Freed Maxick.
Managing a Business Through Uncertainty
Today, businesses are swimming in data both inside and outside the enterprise. While lots of it can be used intelligently, it’s difficult to cull valuable nuggets from the pile and assemble it in ways that deliver useful insights.
Moreover, much of the data available to your business looks backward (e.g., last month, last quarter, last year) at performance and other important metrics. As a result, you as an executive can’t easily plan for growth, monitor current progress, or intervene to prevent the ship from going off course.
Data that is derived from systems and into customized dashboards should help to create better processes, improve efficiencies, reduce risk, and strengthen the bottom line. The analysis of the most timely data provides the best options for leaders to make a more timely, financially sound, and better-informed decision.
MAXIS keeps leaders on track with dashboards that help to navigate uncertainty and propel the journey forward.
Accounting & Advisory Services from MAXIS
Do you have questions about designing and deploying executive dashboards, or other business advisory issues? Schedule a complimentary discussion to determine how MAXIS can help. Please contact Alexis Becker at directly at 716.332.2619 or alexis.becker@freedmaxick.com.